Welcome to the first Fantasy Friday open mic at the coffee shop
The World Series is on! Welcome to your Friday edition of BCB After Dark, where you’ll get the same low-key hang out and excellent baseball conversation with a bit of a Sanchez twist.
As I mentioned yesterday the inspiration for these late week columns is a wonderful corner of Adams Morgan in Washington, D.C. called Tryst, an eclectic coffee shop and bar where the food was amazing and guests could enjoy the standard coffee staples or libation of their choice with a bit of music. I’m excited to add a Fantasy Friday corner to the wonderful franchise Josh has built up with some late night banter for those of us who are a bit more nocturnal for whatever reason. Please bus your own tables, I’d hate to leave a mess for Josh on Monday.
Fridays will be a fantasy baseball focus here at BCB After Dark, but one of the fun things about fantasy baseball is that the analysis being done to win your home league has oftentimes been ahead of the curve for baseball analytics generally. Tonight’s topic is a perfect example of this phenomena because fantasy baseball analysts were panicking about the decline in home runs last season long before the beat writers caught up.
Speaking of big swings, I couldn’t write up this piece without a nod to an all-time great song “Sultans of Swing” by Dire Straits. If you’re unfamiliar with Dire Strait’s lead man Mark Knopfler’s game, perhaps it would interest you to know that the man is so proficient on a guitar that he actually has a dinosaur named after him. Yes, really.
The original song was their breakout hit in 1978. Unfortunately it has absolutely nothing to do with baseball — more below. But first just enjoy the version you’re most likely to hear come on the radio:
It’s a great song. 8/10. Excellent vibes. Really no notes. I could listen to that song on loop. In fact, about 20 years ago, I drove from Salt Lake City to Denver to hang out with a guy I was dating. I listened to Dire Straits plus Mark Knopfler’s solo work the whole way there and didn’t regret a single second of that decision.
Just based on the title of the song I wanted Sultans of Swing to be a song about baseball, but it turns out it’s a song about music. I’ve begrudgingly accepted this over the years because I like music almost as much as I like baseball. As I write this I’ve moved from begrudging acceptance to appreciation that I can highlight a song with a baseball pun in the name and a nod to the jazz ethos of Josh’s original vision of BCB After Dark — the jazz club all in one post.
But the commercially familiar version of Sultans of Swing is far from the whole story. In fact, the commercially familiar version of Dire Straits or Mark Knopfler, while excellent, is just scratching the surface of their game. Because the thing is, Knopfler has some Hall of Fame guitar game and honestly there are lots of versions of this classic song I could have shared to make this point, but this riff stood out. If you’re in the musical interlude because you love great tunes and riffs on classics, I promise you want to devote 10 minutes of your time to this:
That’s an absolutely brilliant display on the guitar by Knopfler and the rest of the band doesn’t miss either. It’s the walk off home run version of a classic by Dire Straits.
Which leads me back to where we began this baseball, classic rock improv session: Where did all the home runs go in 2024 and who spotted the trends first?
It makes sense if you think about it. Baseball analysts are slow and deliberate types. They abhor small sample sizes and aren’t supposed to make any wild calls before the data backs up the call. Fantasy baseball players are competitors trying to beat their friends and colleagues, win money (sometimes lots of it) or both. They can’t figure out why the projections they drafted on don’t match the data they are seeing in the game early and have some powerful personal incentives to move quickly. On this particular issue last season, the first person I heard sound the alarm on MLB’s lack of home runs was Jason Collette of Rotowire on April 9:
2023 resulted in the second lowest change from early season to final season HR/PA rate on the table above trailing only the 2021 season. The average change in HR/PA rate from 2016-2023 comes out to be 6.26 percent, which is relevant when I show where we are at through games played on April 7th, 2024 in the table below:
Needless to say, the league is off to a slow start in the home run department despite the attrition of top-end pitching talent. It bears repeating that this early-season performance has been a rather decent leading indicator to what we can expect for the rest of the season, especially in the post-Covid era where conditions and the production of baseballs appears to have been standardized as much as it can.
A full major league season has averaged 184,214 plate appearances since 2016. If we apply that average to the aforementioned 6.26 percent average change from an early season HR/PA rate to the final HR/PA rate, that calculates out to 5,269 home runs, which would be approximately 600 fewer homers than we saw just last season. That would put the league-wide run environment closer to the 2022 season, where the league finished with 5,215 homers
Now, the league finished better than that 2022 mark of 5,215 and better than the early April projection of 5,269, but not by much. 2024 wound up with the lowest league home run total since 2016 (a year I picked completely at random) as you can see below:
It’s a remarkable decline and one that Jay Jaffe at FanGraphs tried to address in early May. It’s worth reading the whole piece, but this nugget stands out:
Relative to last April, home run rates fell 9.8%, a sizable drop but not the 15.6% slip we get by comparing the first month to the previous full season, with its more homer-conducive warm-weather months. Given the average gap between the April and full season rates over this period (0.097 homers per team per game) and the standard deviation (0.033 homers per game), we should expect this year’s full rate to land in the 1.083–1.148 range. At 1.116 homers per game, the center of that range would represent a 7.6% fall-off from last year, with the extremes at 4.9% and 10.3%.
Anything in that range would represent smaller year-to-year changes than we’ve seen in the post-pandemic period, but it’s still enough to merit a closer look. So what’s happening? Variations in offensive levels and strikeout rates can reduce the number of batted balls and therefore home runs, but even with what we saw in April (lower scoring but also a slightly lower strikeout rate), there were actually more fly balls per game this April than last (6.65 vs. 6.57) — it’s just that those fly balls haven’t traveled as far or done as much damage.
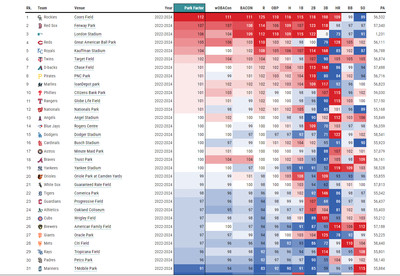
Cubs fans are familiar with this dynamic at least as much as other fanbases. Statcast tracks park effects and generally does so in 3-year intervals to limit the noise that can exist in a single season. That makes a ton of sense but for purposes of evaluating last year’s home run rate decline and its impact on the Cubs, let’s compare the 3-year and 1-year park factors from last season:

Statcast
Wrigley Field is in the lower offensive tier here at 25, just slightly below average relative to other parks. As an aside I will always find it amusing that Wrigley is a pitchers park for basically everything except triples, but I digress. Let’s look at 2024 on its own:

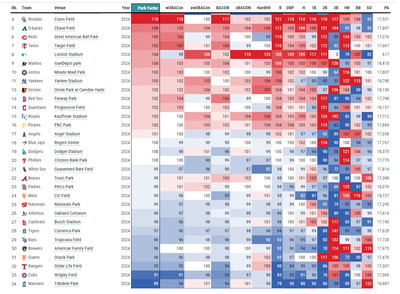
Statcast
Forgive me for starting with Coors Field ranked fourth, but the first three parks are all exhibition fields (Korea Series, Rickwood Field and Mexico Series, in order). So let’s just keep this to MLB parks that see more than a handful of games, shall we? Wrigley Field as the second worst park for offense, just ahead of T-Mobile Park.
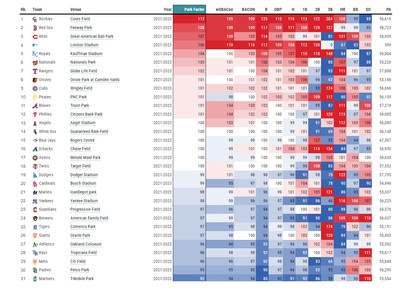
But the plot thickens because this is truly a 2024 anomaly at Wrigley Field. If you look at the 3-year park factors for 2023 Wrigley Field ranks ninth:

Statcast
I recognize these aren’t sortable tables, but I did some sorting for you because I’m sure some of the savvier readers are wondering how much of that park factor change is due to home runs at Wrigley? The answer is a lot. The 3-year park factors for 2021-23 sorted by home runs had Wrigley Field ranked 11th, the 3-year park factors for 2022-24 drop that ranking all the way to 21st, but the real kicker is that the 1-year park factors in 2024 had Wrigley Field at 28th.
So I ask you, Cubs fans: What changes in 2024 occurred to lower home run rates so much and why was Wrigley Field one of the most impacted parks in baseball?
Talk amongst yourselves in the comments. It’s Friday and the conversation and drinks will be flowing for a while. Be sure to stop back in on Monday when Josh brings back BCB After Dark Monday night after a weekend of World Series baseball.
